[vc_row][vc_column][vc_column_text][dvbutton id="5" style="primary" url="http://heidifinn.com/UX"]UX[/dvbutton][/vc_column_text][/vc_column][/vc_row][vc_row][vc_column][vc_column_text]Analytics quantitative data allows us to measure baselines, use those baselines to inform design decisions, and then measure the success or failure of the design.
Descriptive analytics are similar to the counters of old. Descriptive analytics show baselines, such as how many people visit a page, click on a button, or watch a video.
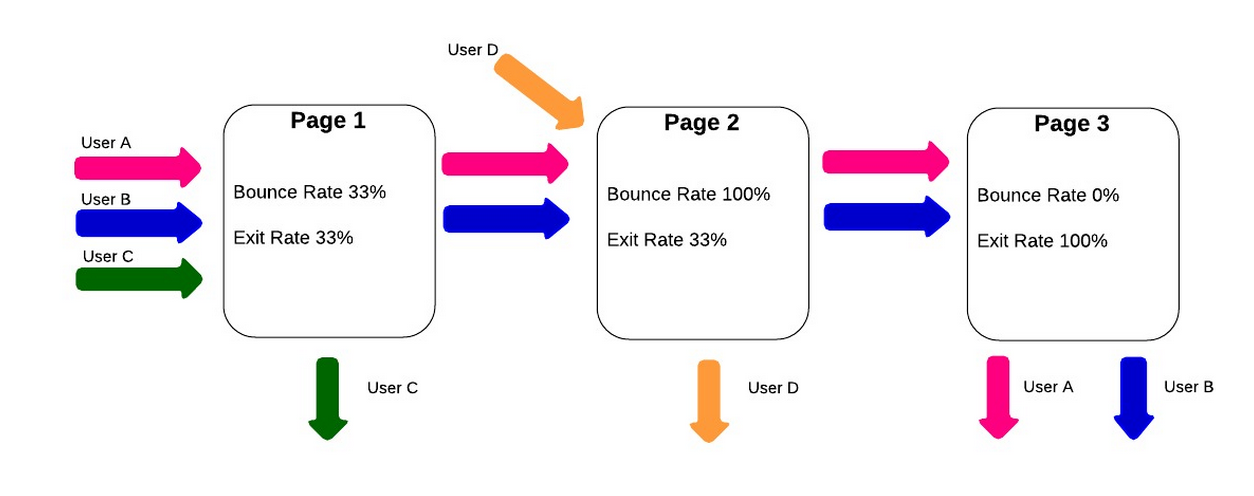
Diagnostic analytics might use the same metrics as descriptive analytics, but with a different purpose. Diagnostic analytics help us understand what happened, and why. For example, if an online retailer is losing money, they might measure the clickthru rates of the links and exit rates of pages along the customer journey, to see where they are losing people.
Prescriptive analytics refers to data that informs someone of what they should do next. For example, when Google Maps collects data about traffic at rush hour, they are able to prescribe a better route for drivers. For those of us who are measuring the effectiveness of design rather than traffic, prescriptive data still identifies patterns, and can thus inform our future design decisions.
Predictive analytics tell us what is likely to happen in a scenario. For example, if we A/B test a new site header against our current site, that test will tell us which header is more likely to convince people to stay on the site. If the new header is more popular, we can predict that our traffic will grow if we implement the new header.
No Comments.